Using AI to make critical flood forecasting information universally accessible
Every year, floods cause thousands of fatalities worldwide, disrupt the lives of millions, and cause significant financial damages. As part of our efforts to advance AI to address the climate crisis and help communities affected, Google Research has developed AI models to forecast floods. Our system combines two AI models that process diverse publicly available data sources: the Hydrologic Model forecasts the amount of water flowing in a river, and the Inundation Model predicts what areas will be affected and how high the water level will be. This way, we can alert people in areas that are about to be impacted up to 7 days before disaster strikes. By warning organizations and people, we hope to empower them to act, limiting damage and loss of life. We work closely with governments, the UN, and NGOs to implement and distribute flood alerts. After many years of intense research and development, our technology is now scalable and covers dozens of countries, and in the future, we aspire to cover all areas affected by floods globally.
Flood Hub for Governments and Organizations
The Flood Hub provides users with locally relevant flood data and flood forecasts up to 7 days in advance so they can take timely action. It is a visual, easy-to-use resource that displays local riverine flood maps and water trends and gives real-time flood forecasts and alerts based on Google's AI models and global data sources. The Flood Hub is designed to meet the needs of governments, local aid organizations, and people directly at risk. All information is free of charge, publicly available, and can be shared over social networks. Forecasts are updated daily.
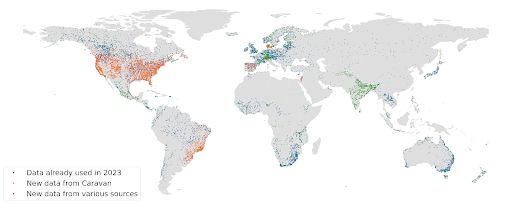
Flood Hub currently covers river basins in over 150 countries worldwide, providing critical flood forecasting to a population of 700M people.
We also provide researchers and experts with expanded coverage — based on “virtual gauges” for locations where data is scarce — via an API, the GRRR dataset, the inundation data set as well an expert data layer on Flood Hub with close to 250,000 forecast points of our Flood Forecasting model, across over 150 countries.

Flood Hub currently covers river basins in over 100 countries with verified data and up to 150 countries with data based on virtual gauges, providing critical flood forecasting to a population of 700M people.
Alerts on Google Search and Google Maps and notifications
We publish our forecasts via alerts on Google Search, Maps, and Android notifications to help more people access flood information.
How it works
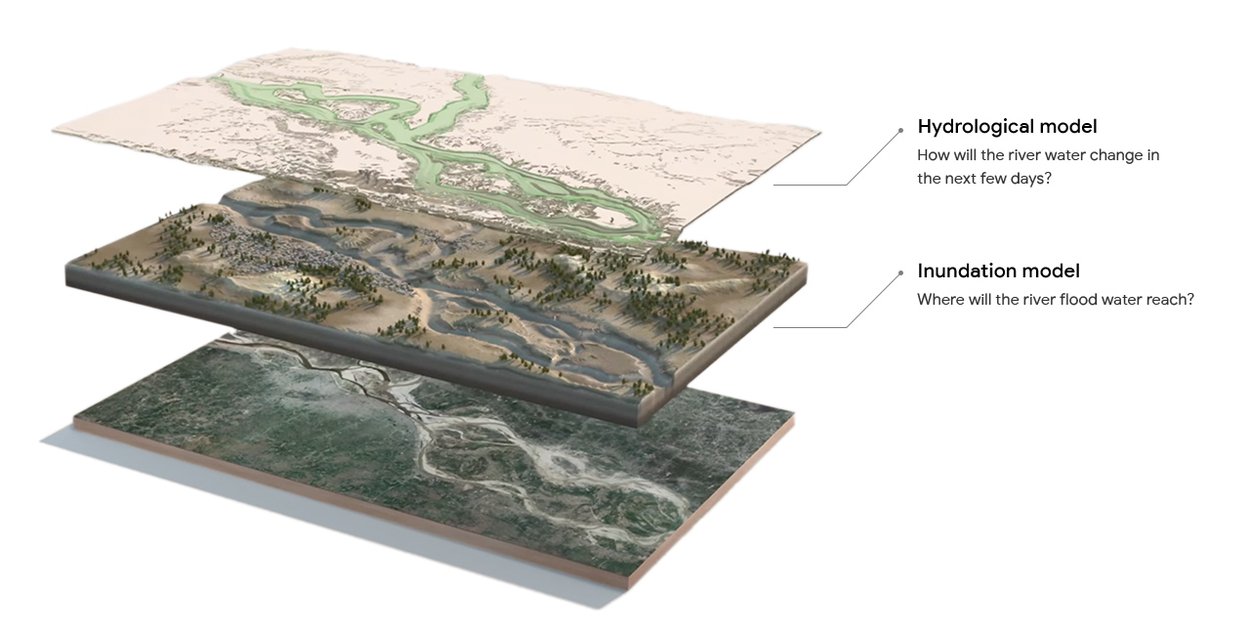
The Hydrologic Model identifies whether a river is expected to flood by processing publicly available data sources, such as precipitation and other weather and basin data, and outputs a forecast for the water level in the river in the following days. The Inundation Model simulates the behavior of the water as it moves across the floodplain based on the hydrology forecast and satellite imagery. This allows us to know which areas are going to be affected and how high we expect the water level to be.
Our groundbreaking AI model combines these two models to achieve unprecedented accuracy:
- Provides more actionable and accurate forecasts (when compared to the state-of-the-art, widely-used globally-available model, GloFAS) to empower governments, relief organizations, and citizens to take relevant actions and save lives.
- Can evaluate whether a river’s water level will rise or fall and by how much up to 7 days in advance, and depending on data availability, generates maps that showcase which specific areas are expected to flood.
- Is trained on a wide variety of publicly available global weather products, river gauge measurements and satellite imagery.
- Can be applied to locations for which we have river gauge data, and more importantly, can infer from data-rich to data-scarce locations, enabling us to provide coverage in many low and medium-income countries (LMIC).
Discover more