Open Buildings 2.5D Temporal Dataset
Dataset Description
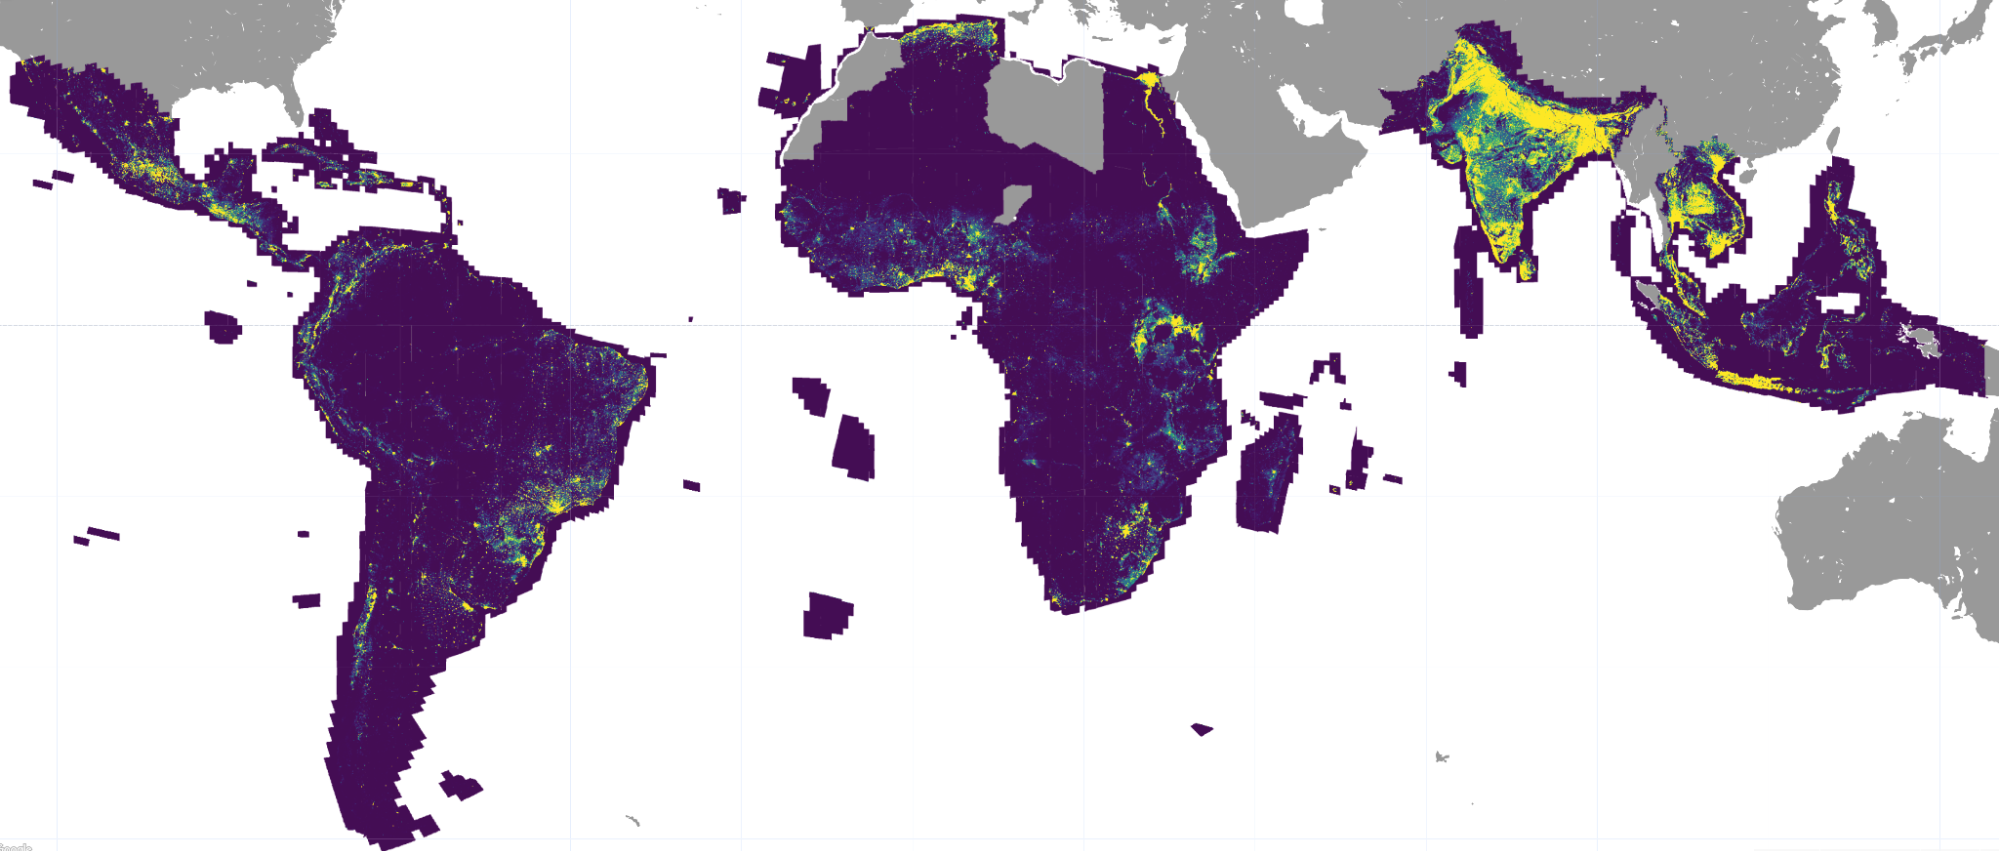
The Open Buildings 2.5D Temporal Dataset contains annual data spanning eight years (2016-2023) with building presence, fractional building counts, and building heights covering approximately 58 million square kilometers. It was produced using publicly available, low-resolution imagery from the Sentinel-2 satellite mission, which has approximately 5-day revisit times and world-wide coverage. The resulting dataset has an effective spatial resolution of 4 meters, equivalent to what could be achieved by a high-resolution model using a single frame of 4-meter resolution imagery. The Open Buildings 2.5D Temporal Dataset is available across Africa, South Asia, South-East Asia, Latin America and the Caribbean.
The goal is to support organizations (e.g., governmental, non-profits, commercial) working on projects that benefit society, such as promoting sustainable development, disaster response and improving access to public healthcare, among other things. See the related Research Blog post to learn more.
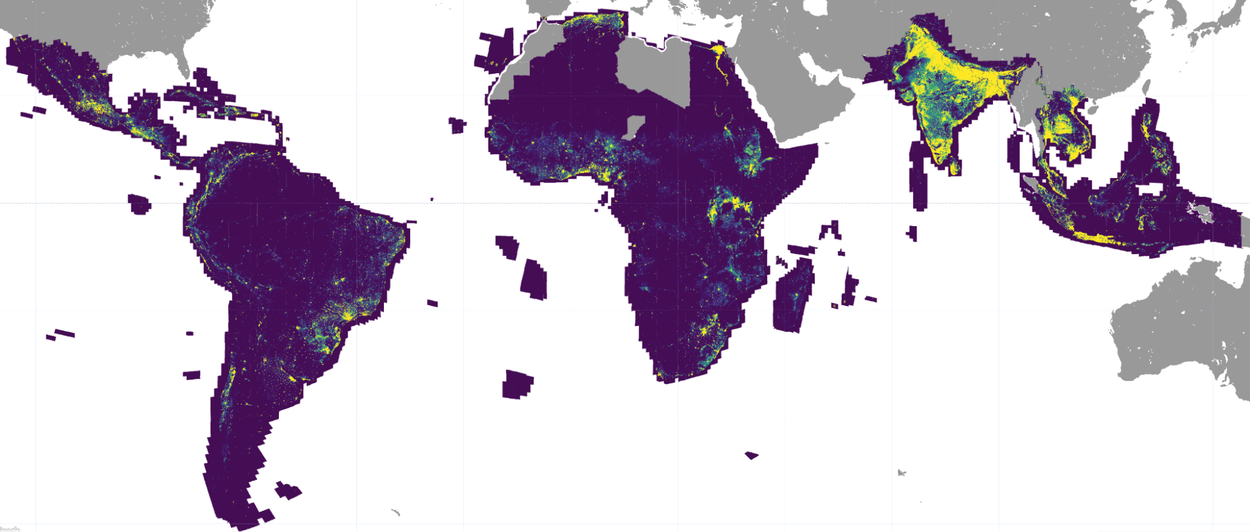
The Open Buildings 2.5D Temporal Dataset coverage across the globe.
Uses of the data
Potential use cases of the Open Buildings 2.5D Temporal Dataset include:
- Urbanization: The temporal aspect of this dataset allows users to study the evolution of cities and settlements over time. This is crucial for understanding where additional investments in infrastructure are necessary.
- Environmental science: Information about the pace of construction will help users understand how human activities impact natural resources.
- Population mapping: The dataset can be leveraged to produce population maps that include building heights at various timestamps, providing important signals for the planning and validation of national and local census.
- Public health planning: The dataset freshness and building heights information can inform vaccination campaign planning or policies aiming to improve access to healthcare.
- Humanitarian aid and disaster response: The dataset provides fresh and accurate estimates of buildings, including their heights to better estimate the scale of impacted populations in the areas affected by a disaster.
We are interested in learning about how others are leveraging this data. If you have a use case you would like to share, please email us at open-buildings-dataset@google.com.
Explore
To explore the dataset, you can use the interactive Earth Engine dataset explorer (shown below). The explorer allows you to visualize different bands, inspect raster values, and even count buildings in a selected area. All the data is fully explorable, and some locations of interest are provided for quick reference.
In case you encounter performance issues with the Earth Engine app, please try this Earth Engine script instead. If you'd like to know more about our methods, quality and data limitations check out the FAQ, Research Blog, and technical report.
Download
The dataset is composed of a single Earth Engine Image Collection with three rasters as different channels: building presence, building height, and fractional building counts.
Earth Engine users can access the Open Buildings Temporal dataset as an Image Collection, and all relevant technical details are provided in the description. Alternatively, you can download the raster data directly from Google Cloud Storage using this colab for a given area of interest and timeframe.
Frequently asked questions
Open Buildings
- Image source: High-resolution 50 cm satellite imagery.
- Format: Building polygons with additional attributes e.g., confidence values.
- Spatial coverage: Subset of Global South.
- Temporal coverage: A temporal mosaic with freshness varying per location.
- Model: See arXiv:2107.12283.
Open Buildings 2.5D Temporal
- Image source: Copernicus Sentinel-2 imagery.
- Format: Per pixel rasters: building presence, building count, building height.
- Spatial coverage: Subset of Global South (same as the V3 Open Buildings Dataset).
- Temporal coverage: Annual: 2016-2023. Each year is temporally uniform.
- Model: See arXiv:2310.11622.
Currently the Open Buildings 2.5D Temporal dataset geographic coverage includes the following list of countries; however, this list is subject to change.
List of Countries:
ARG Argentina, ATG Antigua and Barbuda, BDI Burundi, BEN Benin, BFA Burkina Faso, BGD Bangladesh, BHS The Bahamas, BLM Saint Barthelemy, BLZ Belize, BOL Bolivia, BRA Brazil, BRB Barbados, BRN Brunei, BTN Bhutan, BWA Botswana, CAF Central African Republic, CHL Chile, CIV Ivory Coast, CMR Cameroon, COD Democratic Republic of the Congo, COG Republic of Congo, COL Colombia, COM Comoros, CPV Cape Verde, CRI Costa Rica, CUB Cuba, CUW Curaçao, CYM Cayman Islands, DJI Djibouti, DMA Dominica, DOM Dominican Republic, DZA Algeria, ECU Ecuador, EGY Egypt, ERI Eritrea, ETH Ethiopia, FLK Falkland Islands, GAB Gabon, GHA Ghana, GIN Guinea, GMB Gambia, GNB Guinea Bissau, GNQ Equatorial Guinea, GRD Grenada, GTM Guatemala, GUY Guyana, HND Honduras, HTI Haiti, IDN Indonesia, IND India, IOT British Indian Ocean Territory, JAM Jamaica, KEN Kenya, KHM Cambodia, KNA Saint Kitts and Nevis, LAO Laos, LBR Liberia, LCA Saint Lucia, LKA Sri Lanka, LSO Lesotho, MAF Saint Martin, MDG Madagascar, MDV Maldives, MEX Mexico, MLI Mali, MOZ Mozambique, MRT Mauritania, MSR Montserrat, MUS Mauritius, MWI Malawi, MYS Malaysia, MYT Mayotte, NAM Namibia, NER Niger, NGA Nigeria, NIC Nicaragua, NPL Nepal, PAN Panama, PER Peru, PHL Philippines, PRI Puerto Rico, PRY Paraguay, RWA Rwanda, SDN Sudan, SEN Senegal, SGP Singapore, SHN Saint Helena, SLE Sierra Leone, SLV El Salvador, SOM Somalia, STP Sao Tome and Principe, SUR Suriname, SWZ Eswatini, SXM Sint Maarten, SYC Seychelles, TCA Turks and Caicos Islands, TCD Chad, TGO Togo, THA Thailand, TLS East Timor, TTO Trinidad and Tobago, TUN Tunisia, TZA United Republic of Tanzania, UGA Uganda, URY Uruguay, VCT Saint Vincent and the Grenadines, VEN Venezuela,V GB British Virgin Islands, VIR United States Virgin Islands, VNM Vietnam, ZAF South Africa, ZMB Zambia, ZWE Zimbabwe
A deep learning model was trained to detect per pixel building presence, fractional counts and height using Copernicus Sentinel-2 imagery. We then ran inference for this model on stacks of 32 Sentinel-2 images centered around the 30th of June of each year (2016 - 2023) for most of the Global South. Only opaque-cloud-free images were used (according to the QA60 band). Heights for non-building objects were masked out using the building presence output of the model. The accompanying technical report describes the training and evaluation of the model.
Owing to the vast scale of the data processing, covering approximately 58 million square kilometers and spanning eight years, inference was run on TPUs. The resulting float rasters were then ingested into Google Earth Engine as an ImageCollection.
The effective spatial resolution is around 4 meters (rasters files are provided at 50 cm). The mean absolute error of building height prediction is 1.5 meters and was only evaluated in North America, Europe and Japan. The building height raster is only a relative measure (height above ground) and not an absolute measure of the location’s height. Moreover, given the effective spatial resolution of around 4 meters, we expect the absolute position of the building roof will also be shifted.
Model confidence values are uncalibrated, meaning, if the model assigns a confidence value of 0.8 that there is a building at a certain pixel it does not mean the actual likelihood of building presence is 80%. As such, confidence values can only be used for relative ranking (e.g., thresholding) of pixels. Also note that the model confidence can vary across location and time based on a number of factors, such as cloud cover, imagery misalignment, etc. Score thresholds found based on our validation data can be seen in table 11 of the technical report.
The building height raster should be only used in conjunction with the building presence raster, i.e., pixels with low confidence in building presence raster should be masked in the building height raster.
The Sentinel-2 images are not aligned with the imagery in Google Maps. Moreover, the individual Sentinel-2 images are not fully aligned to each other. Due to that the model output can often be misaligned with imagery in Google Maps and there can even be a slight spatial drift between different years of the dataset. To learn a little more about satellite imagery offset see these sites (1, 2). Also see the technical report for details about data limitations and quality.
There are a few limitations that you may want to keep in mind:
- Data availability: It could be that in very cloudy places we weren't able to create a full stack of usable imagery (16 frames before and 16 after the inference date). This could have affected the quality of the results.
- Spatial stability: Detections across time are not always aligned (example of small spatial jitter, demo link). This has to do with the inherent misalignment between input imagery. More on this also in the paper.
- Temporal stability: Detections across time are not always stable, meaning the same building could be assigned different confidences or height over time. Furthermore, aggregates like building count over an area could also be unstable depending on the region (example). This is due to factors like cloud cover, misalignment between input images and fewer Sentinel-2 timeframes for years 2016-2017 (example, demo link).
- Tiling artifacts: The dataset was generated by running inference on stacks of Sentinel-2 images divided into tiles. And since the model output isn’t expected to be spatially aligned with the neighboring tiles, this might result in tiling artifacts. (example).
- Limited heights ground truth data: Ground truth data for heights was only available in the Global North, and therefore heights prediction might not be as good in the Global South (e.g., potential large errors for tall buildings). For the same reason, performance evaluation in the Global South was mostly qualitative. Heights for non-building objects were masked out using building presence output of the model, which can sometimes introduce artifacts if, e.g., a tree was occluding a building. Heights for buildings are capped at 100 meters.
- Smaller buildings: Tiny buildings / tents (e.g., sparse refugee settlements) might not be detected with high confidence. Small touching buildings might not be resolved individually and may be shown as a single blob. Output is not guaranteed to be orthorectified, especially for tall buildings.
- False positives: Some natural features, e.g., rocks, snow (example , demo link) and ground discolorations as well as human built structures like solar panels (example, demo link) and agricultural foil greenhouses (example, demo link) can be incorrectly detected as buildings. False positives are also more likely to be present in locations where only a small number of frames could be used (example, demo link).
See the paper for more details about our approach and evaluation metrics.
The data is shared under the Creative Commons Attribution (CC BY-4.0) license and the Open Data Commons Open Database License (ODbL) v1.0 license. Users can review the terms for both licenses and select the license they prefer to use the data under. However, please note the liability disclaimer in the footnotes.
We have leveraged Copernicus Sentinel data (2016-2023) processed by the European Space Agency.
We wanted to make the data compatible for ingestion by those working with ODbL-licensed datasets (namely the OpenStreetMap community) while enabling people who don't use ODbL licensing to use it under the terms of the CC BY-4.0 license. We hoped to take away the burden of figuring out whether the two licenses were compatible and simply release the dataset under both licenses.
The model is trained and run on Sentinel-2 satellite imagery, which is publicly accessible through the Earth Engine Data Catalog. However, high-resolution imagery and the associated annotations used for training the teacher model (that generates labels for the Sentinel-2 stack) is not publicly released.
To access the model, please contact open-buildings-dataset@google.com detailing your intended use case and organization. Requests will be evaluated on a case-by-case basis.
We can run inference for timestamps of interest or at higher than annual temporal frequency, so long as there are sufficient opaque-cloud-free images. Please contact open-buildings-dataset@google.com detailing your intended use case and organization. Requests will be evaluated on a case-by-case basis.
Sensitive areas, including conflict zones, were omitted from consideration to protect at-risk populations. The list of excluded areas is subject to change.
If this dataset is useful, please consider citing the technical report:
W. Sirko, E.A. Brempong, J.T.C. Marcos, A. Annkah, A. Korme, M.A. Hassen, K. Sapkota, T. Shekel, A. Diack, S. Nevo, J. Hickey, J.A. Quinn. High-Resolution Building and Road Detection from Sentinel-2. arXiv:2310.11622, 2023.
Please contact open-buildings-dataset@google.com with any feedback.
-
TO THE FULLEST EXTENT PERMITTED BY APPLICABLE LAW, IN NO EVENT WILL ANY OF THE LICENSORS OR ANY THIRD PARTY THAT PUBLISHES ANY LICENSED MATERIAL BE LIABLE TO YOU ON ANY LEGAL THEORY FOR ANY INCIDENTAL, DIRECT, INDIRECT, PUNITIVE, ACTUAL, SPECIAL, EXEMPLARY, OR OTHER DAMAGES, INCLUDING WITHOUT LIMITATION, LOSS OF REVENUE OR INCOME, LOST PROFITS, PAIN AND SUFFERING, EMOTIONAL DISTRESS, COST OF SUBSTITUTE GOODS OR SERVICES, OR SIMILAR DAMAGES SUFFERED OR INCURRED BY YOU OR ANY THIRD PARTY THAT ARISE IN CONNECTION WITH SUCH MATERIALS (OR THE TERMINATION THEREOF FOR ANY REASON), EVEN IF ANY OF THE LICENSORS OR ANY THIRD PARTY HAS BEEN ADVISED OF THE POSSIBILITY OF SUCH DAMAGES. TO THE FULLEST EXTENT PERMITTED BY APPLICABLE LAW, ANY OF THE LICENSORS OR ANY THIRD PARTY IS NOT RESPONSIBLE OR LIABLE WHATSOEVER IN ANY MANNER FOR ANY CONTENT POSTED ON OR AVAILABLE THROUGH THE RELEVANT MATERIALS (INCLUDING CLAIMS OF INFRINGEMENT RELATING TO THAT CONTENT), FOR YOUR USE OF THE MATERIALS.