Overview
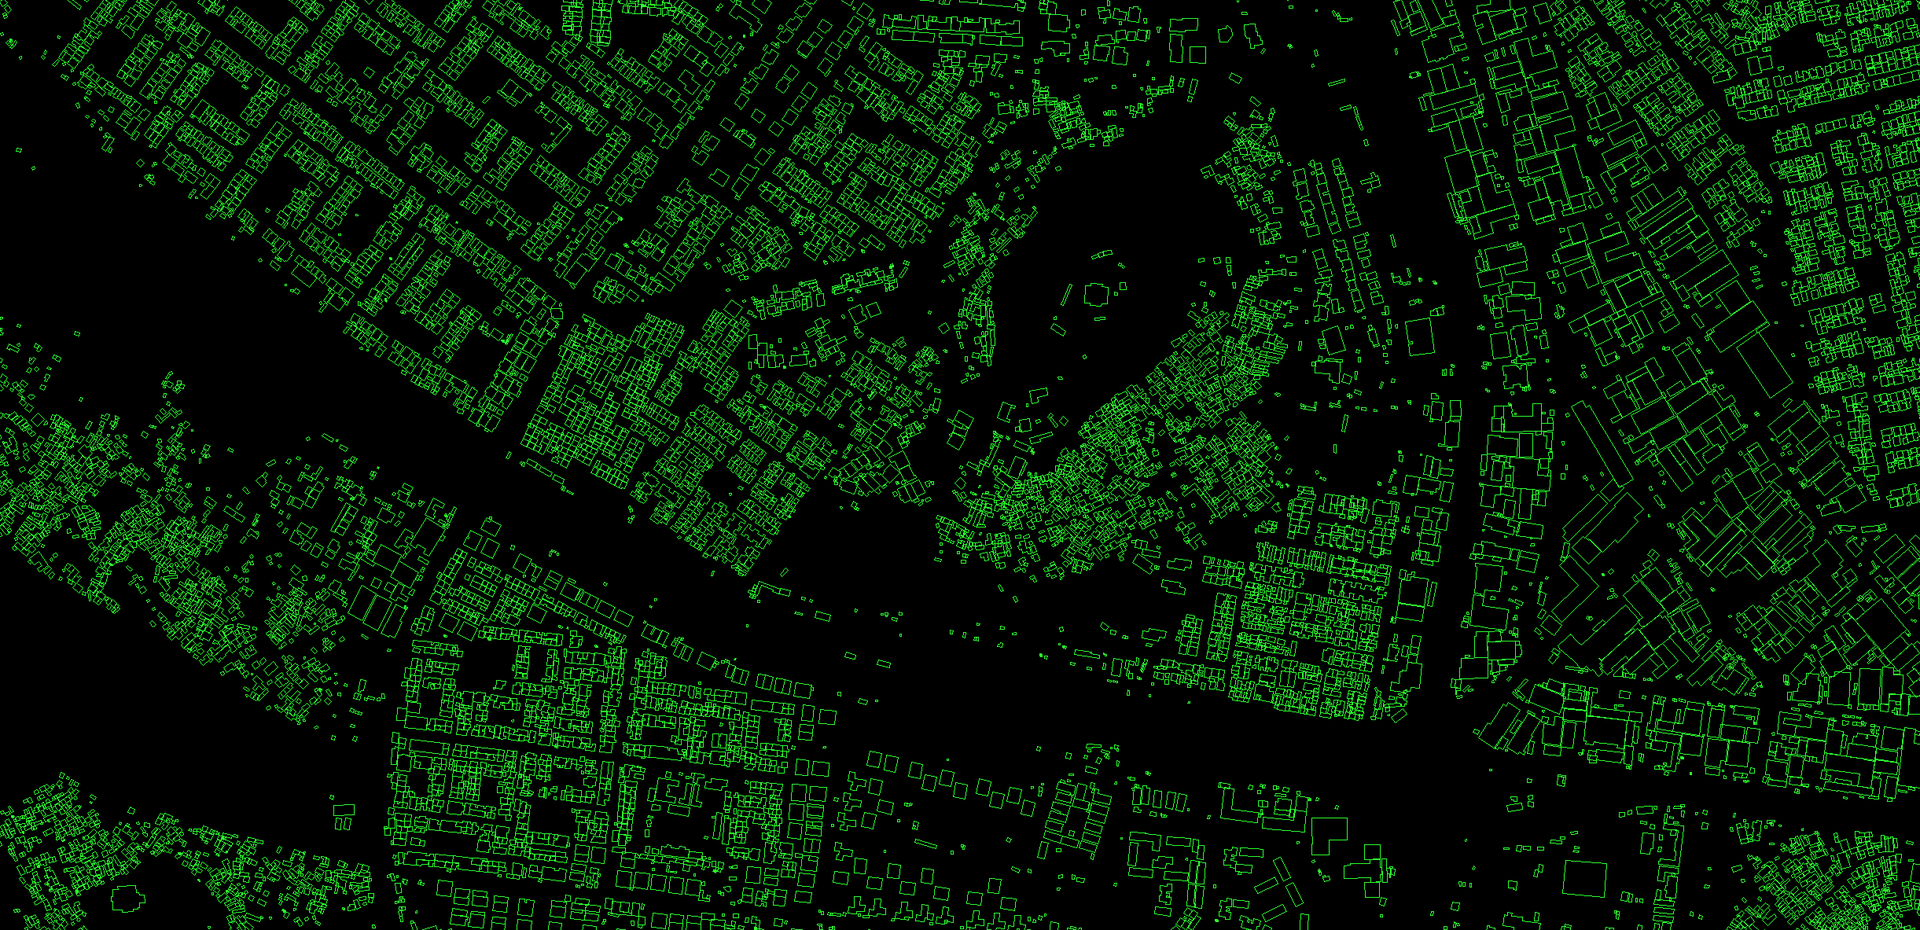
Building footprints are useful for a range of important applications, from population estimation, urban planning and humanitarian response, to environmental and climate science. This large-scale open dataset contains the outlines of buildings derived from high-resolution satellite imagery in order to support these types of uses. The project is based in Google's Ghana office, focusing on the continent of Africa and the Global South at large.
Quick links
Dataset description
The dataset contains 1.8 billion building detections, across an inference area of 58M km2 covering Africa, South Asia, South-East Asia, Latin America and the Caribbean. The current dataset is in its 3rd version.
For each building in this dataset we include the polygon describing its footprint on the ground, a confidence score indicating how sure we are that this is a building, and a Plus Code corresponding to the centre of the building. There is no information about the type of building, its street address, or any details other than its geometry.
Uses of the data
Potential use cases of the data include:
- Population mapping: Building footprints are a key ingredient for estimating population density. In areas of rapid change, or where census information is out of date, population estimates are vital for many kinds of planning and statistics.
- Humanitarian response: To plan the response to a flood, drought, or other natural disaster, it is useful to assess the number of buildings or households affected. This is also useful for disaster risk reduction, e.g. to estimate the number of buildings in a particular hazard area.
- Environmental science: Knowledge of settlement density is useful for understanding human impact on the natural environment. For example, it helps with estimating energy needs and carbon emissions in a certain area, or pressure on protected areas and wildlife due to urbanisation.
- Addressing systems: In many areas buildings do not have formal addresses, which can make it difficult for people to access social benefits and economic opportunities. Building footprint data can help with the rollout of digital addressing systems such as Plus Codes.
- Vaccination planning: Knowing the density of population and settlements helps to anticipate demand for vaccines and the best locations for facilities. This data is also useful for precision epidemiology, as well as eradication efforts such as mosquito net distribution.
- Statistical indicators: Buildings data can be used to help calculate statistical indicators for national planning, such as the numbers of houses in the catchment areas of schools and health centres; mean travel distances to the nearest hospital or forecast of demand for transportation systems.
How Partners Have Leveraged the Open Buildings Dataset

Sunbird AI is a Ugandan nonprofit that uses data technology for social good. They have used Open Buildings to support planning at the Ministry of Energy in Uganda. With building footprint data, they can see which are the priority areas for electrification, estimating where commercial centers are, and areas with large population, or areas with essential services like schools and hospitals. Some of these are settlements which otherwise might be overlooked because they are literally not on the map.

The UN Refugee Agency, UNHCR, has used Open Buildings for survey sampling. It’s common to do household surveys in regions where people have been displaced, in order to know what people need. But UNHCR needs to first have an assessment of where the households actually are, which is where the Open Buildings project has been useful.

UN Habitat has used Open Buildings to study urbanization across the African continent. Having detail on the way that cities are laid out enables them to make recommendations on urban planning.

The International Energy Agency has used Open Buildings to estimate energy needs. With data about individual buildings, they can assess the needs of communities at a new level of precision and know how much energy is needed for cooking, lighting and for operating machinery. This will help with planning sustainable energy policy.
Explore the Open Buildings data
| confidence >= 0.75 | |
| 0.7 < confidence < 0.75 | |
| 0.65 <= confidence < 0.7 |
Data format
The dataset consists of 3 parts: building polygons, building points and score thresholds.
Building polygons and points
Building polygons and points are stored in spatially sharded CSVs with one CSV per S2 cell level 4. Each row in the CSV represents one building polygon or point and has the following columns:
- latitude: latitude of the building polygon centroid,
- longitude: longitude of the building polygon centroid,
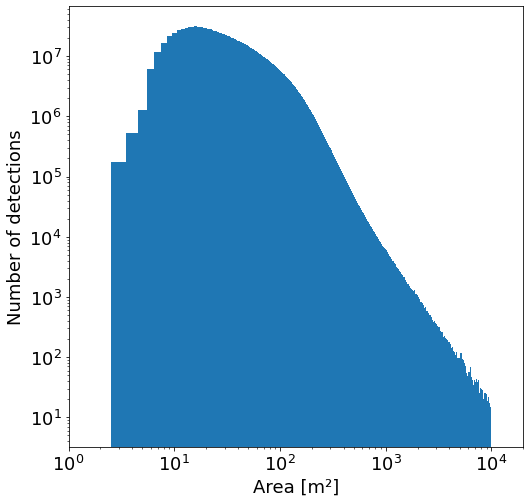
- area_in_meters: area in square meters of the polygon,
- confidence: confidence score [0.65;1.0] assigned by the model,
- geometry: the building polygon in the WKT format (POLYGON or MULTIPOLYGON). This feature is present in only in polygons data,
- full_plus_code: the full Plus Code at the building polygon centroid.
Score thresholds
The estimated score thresholds are stored as one CSV. Each row in the CSV represents one S2 cell level 4 bucket and has the following columns:
- s2_token: S2 cell token of the bucket,
- geometry: geometry in the WKT format of the S2 cell bucket,
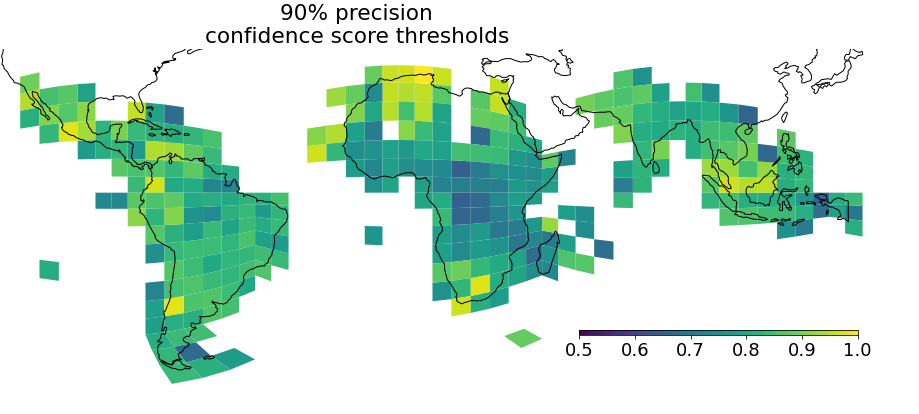
- confidence_threshold_80%_precision, confidence_threshold_85%_precision, confidence_threshold_90%_precision: estimated confidence score threshold to get specific precision for building polygons in this S2 cell bucket,
- building_count_80%_precision, building_count_85%_precision, building_count_90%_precision: number of building polygons in this S2 cell bucket with confidence score greater than or equal to the score threshold needed to get the specific precision,
- building_count: number of building polygons in this S2 cell bucket,
- num_samples: number of samples used for generating the score threshold. This feature exists from v2 onwards.
Download
The polygon data (178 GB total) is composed of a set of CSV files, with one file per level 4 S2 cell that are up to 7.8 GB in size. Similarly, the points data (48 GB total) are up to 2.1 GB per file. Select a download method below.
Download from the map
To manually download polygons data for a specific cell, click on the map below.
Download polygons or points data for a specific country or region
This Colab notebook shows how data can be downloaded for a specific country or region.
Or you can use the UN Humantatian Data Exchange (HDX), where the HDX team curated 20 country level datasets to better enable humanitarian response use.
Download all data
Download all polygons using gsutil (178 GB total):
gsutil cp -R gs://open-buildings-data/v3/polygons_s2_level_4_gzip
Download all points (48 GB total):
gsutil cp -R gs://open-buildings-data/v3/points_s2_level_4_gzip
Download metadata
Metadata files can be downloaded as follows:
- Tile geometry and URLs in geojson format.
- Score thresholds CSV file.
Download score thresholds using gsutil:
gsutil cp gs://open-buildings-data/v3/score_thresholds_s2_level_4.csv
Version history
v1: inference carried out during April 2021 on imagery covering 19.4M km2 of Africa.
v2: inference carried out during August 2022 on imagery covering 39.1M km2 of Africa, South and South-East Asia.
v3: inference carried out during May 2023 on imagery covering 58M km2 of Africa, South and South-East Asia, Latin America and the Caribbean. See FAQ for comparison of versions.
FAQ
Currently the Open Buildings V3 dataset geographic coverage includes the following list of countries; however, this list is subject to change.
List of Countries:
ARG Argentina, ATG Antigua and Barbuda, BDI Burundi, BEN Benin, BFA Burkina Faso, BGD Bangladesh, BHS The Bahamas, BLM Saint Barthelemy, BLZ Belize, BOL Bolivia, BRA Brazil, BRB Barbados, BRN Brunei, BTN Bhutan, BWA Botswana, CAF Central African Republic, CHL Chile, CIV Ivory Coast, CMR Cameroon, COD Democratic Republic of the Congo, COG Republic of Congo, COL Colombia, COM Comoros, CPV Cape Verde, CRI Costa Rica, CUB Cuba, CUW Curaçao, CYM Cayman Islands, DJI Djibouti, DMA Dominica, DOM Dominican Republic, DZA Algeria, ECU Ecuador, EGY Egypt, ERI Eritrea, ETH Ethiopia, FLK Falkland Islands, GAB Gabon, GHA Ghana, GIN Guinea, GMB Gambia, GNB Guinea Bissau, GNQ Equatorial Guinea, GRD Grenada, GTM Guatemala, GUY Guyana, HND Honduras, HTI Haiti, IDN Indonesia, IND India, IOT British Indian Ocean Territory, JAM Jamaica, KEN Kenya, KHM Cambodia, KNA Saint Kitts and Nevis, LAO Laos, LBR Liberia, LCA Saint Lucia, LKA Sri Lanka, LSO Lesotho, MAF Saint Martin, MDG Madagascar, MDV Maldives, MEX Mexico, MOZ Mozambique, MRT Mauritania, MSR Montserrat, MUS Mauritius, MWI Malawi, MYS Malaysia, MYT Mayotte, NAM Namibia, NER Niger, NGA Nigeria, NIC Nicaragua, NPL Nepal, PAN Panama, PER Peru, PHL Philippines, PRI Puerto Rico, PRY Paraguay, RWA Rwanda, SDN Sudan, SEN Senegal, SGP Singapore, SHN Saint Helena, SLE Sierra Leone, SLV El Salvador, SOM Somalia, STP Sao Tome and Principe, SUR Suriname, SWZ Eswatini, SXM Sint Maarten, SYC Seychelles, TCA Turks and Caicos Islands, TGO Togo, THA Thailand, TLS East Timor, TTO Trinidad and Tobago, TUN Tunisia, TZA United Republic of Tanzania, UGA Uganda, URY Uruguay, VCT Saint Vincent and the Grenadines, VEN Venezuela, VGB British Virgin Islands, VIR United States Virgin Islands, VNM Vietnam, ZAF South Africa, ZMB Zambia, ZWE Zimbabwe
A deep learning model was trained to determine the footprints of buildings from high resolution satellite imagery. Our accompanying technical report describes the methodology used to generate the first version of the dataset. We however made further improvements for the subsequent versions, v2 and v3.
The data is shared under the Creative Commons Attribution (CC BY-4.0) license and the Open Data Commons Open Database License (ODbL) v1.0 license. As the user, you can pick which of the two licenses you prefer and use the data under the terms of that license. However, please note the liability disclaimer in the footnotes.
We wanted to make the data compatible for ingestion by those working with ODbL-licensed datasets (namely the OpenStreetMap community) while enabling people who don't use ODbL licensing to use it under the terms of the CC BY-4.0 license. We hoped to take away the burden of figuring out whether the two licenses were compatible and simply release the data set under both licenses.
Yes – however, to maintain the quality of OSM, please be mindful of the need for human review when adding machine-generated features, and where possible to do this with the benefit of local knowledge. Errors in the data to look out for include false detections and inaccurate shapes (see more about accuracy below). We also recommend starting by filtering out building detections that have a confidence score below the estimated 90% precision threshold.
The buildings on Google Maps come from a variety of sources, including the model used to generate this dataset. So there is some overlap, but the sets of footprints are not exactly the same.
As the imagery in Google Maps is updated over time, the specific images used to identify these buildings are not necessarily the same images that are currently published in Google Maps. If there is a misalignment between these two sets of imagery, buildings displayed in the data explorer map may appear to be offset from the underlying imagery.
You can view a timeline of the imagery for a specific area using the Historical Imagery feature in Google Earth Pro which may show this imagery offset between different images and dates. To learn a little more about satellite imagery offset see these sites (1, 2). Also see the technical report for details about data limitations and quality.
Despite having a diverse set of training data, some scenarios are challenging for the building detection pipeline, including: 1) geological or vegetation features which can be confused with built structures; 2) settlements with many contiguous buildings not having clear delineations; 3) areas characterised by small buildings, which can appear only a few pixels wide at the given image resolution; 4) rural or desert areas, where buildings constructed with natural materials tend to visually blend into the surrounding area; 5) areas with high-rise buildings: our model is trained to detect building rooftop rather than base and as a result, depending on satellite image's viewing angle, roofs of high rise buildings jump around which makes it challenging to track buildings across a stack of imagery in a given location. See the technical report for more details.
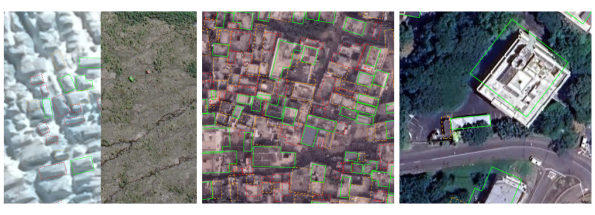
From left to right: false positives on natural features (glacier and rocks), contiguous buildings without clear delineation, shifted footprint due to high-rise building.
The data is subject to both omission and commission errors, of these types:
Imagery completeness errors: for some areas, up-to-date satellite imagery may not have been available, or there were buildings on the ground that were not visible from the satellite image, or there was cloud cover.
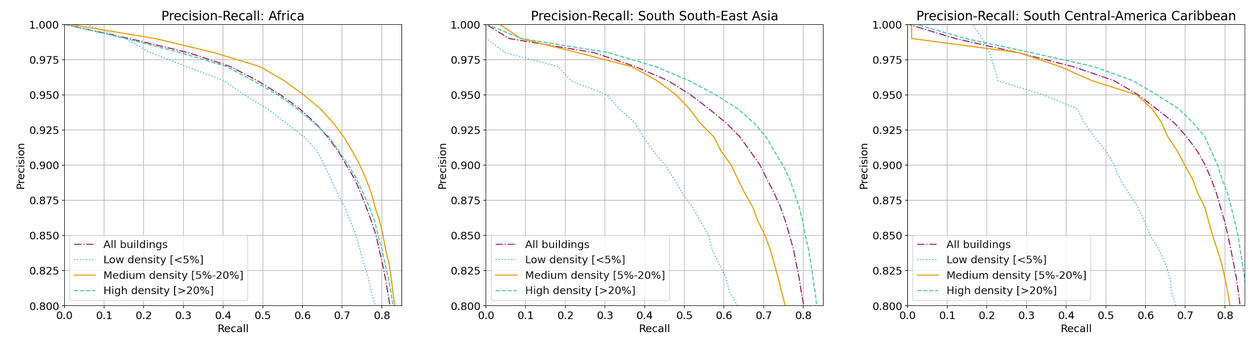
Detection errors: estimated precision and recall curves for our detection model, based on a held-out test set, are as shown below. For more details, including confidence score thresholds, click on the plot. A further breakdown based on density (fraction of image occupied by buildings) is also shown.
Our model sometimes wrongly detects buildings where there are actually rocks or vegetation features, for example.
By choosing the confidence score threshold at which buildings are filtered out, the tradeoff between precision and recall can be controlled. We provide suggested thresholds with each download tile to obtain estimated 80% and 90% precision levels.
Yes, see plots below. To address this we provide a CSV file with suggested score thresholds to obtain specific precision levels for each download tile.
The dataset freshness is determined by the availability of the high-resolution source imagery which we use to detect buildings. While we have tried to include the most recent images possible, particularly in populated areas, in some cases, the most recent image for some location was several years old or not available to us at all. To look at freshness for a particular area, the Historical Imagery function in Google Earth Pro shows the specific dates and imagery (check for imagery before the inference date given in the version history below). Furthermore, we have not processed imagery for the entire continent: to check whether a particular region has been included, the dataset explorer map above visualises all buildings in the dataset.
We filtered detections to include only those with confidence score 0.65 or greater. Depending on the application, it may be necessary to filter at a higher threshold (e.g. with the score thresholds above to achieve 90% precision).

We currently provide 3 options:
- CSV files. See the Data format and Download sections.
- Earth Engine asset. See this catalog page.
- Explorer embedded in this website. See Explore section.
The data is organised into tiles that can be directly downloaded. Alternatively, the example Colab notebook shows how to download data for a specific region, given the geometry of the area of interest.
The underlying satellite imagery is not part of this dataset. However, the source imagery used for detections can be viewed in Google Earth Pro. Different time frames can be viewed using the Historical Imagery function.
In this Colab notebook , we demonstrate some analysis methods on the data for a specific country or region:
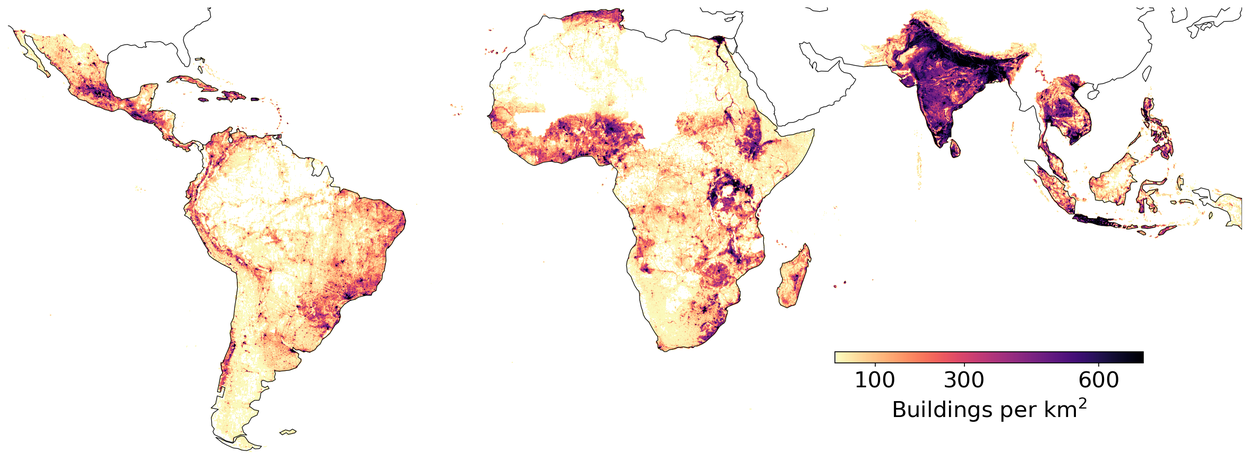
- Generating heatmaps of building density and size, and how to save this information in GeoTIFF format.
- Analysis of accessibility to health sites.
We hope to continue improving this dataset, by both refreshing it using new source imagery, and by refining the detection model to improve accuracy. Based on community feedback, we may extend the dataset to new areas or add additional features: please let us know, using the contact details below, any queries or requests.
The previous versions, like the current version v3, will be hosted in cloud and can be accessed using the same commands as v3, with v3 replaced by either v1 or v2.
The current version, v3, adds new regions in Latin America and the Caribbean (in addition to Africa, South Asia and South East Asia in the previous versions), has improved accuracy, and is based on more up-to-date satellite imagery. Click here to view differences in precision-recall curves. We further provide breakdown of precision-recall curves based on building density.
If this dataset is useful, please consider citing our technical report:
W. Sirko, S. Kashubin, M. Ritter, A. Annkah, Y.S.E. Bouchareb, Y. Dauphin, D. Keysers, M. Neumann, M. Cisse, J.A. Quinn. Continental-scale building detection from high resolution satellite imagery. arXiv:2107.12283, 2021.
Sensitive areas, including conflict zones, were omitted from consideration to protect at-risk populations. The list of excluded areas is subject to change.
Please contact open-buildings-dataset@google.com with any feedback.
-
TO THE FULLEST EXTENT PERMITTED BY APPLICABLE LAW, IN NO EVENT WILL ANY OF THE LICENSORS OR ANY THIRD PARTY THAT PUBLISHES ANY LICENSED MATERIAL BE LIABLE TO YOU ON ANY LEGAL THEORY FOR ANY INCIDENTAL, DIRECT, INDIRECT, PUNITIVE, ACTUAL, SPECIAL, EXEMPLARY, OR OTHER DAMAGES, INCLUDING WITHOUT LIMITATION, LOSS OF REVENUE OR INCOME, LOST PROFITS, PAIN AND SUFFERING, EMOTIONAL DISTRESS, COST OF SUBSTITUTE GOODS OR SERVICES, OR SIMILAR DAMAGES SUFFERED OR INCURRED BY YOU OR ANY THIRD PARTY THAT ARISE IN CONNECTION WITH SUCH MATERIALS (OR THE TERMINATION THEREOF FOR ANY REASON), EVEN IF ANY OF THE LICENSORS OR ANY THIRD PARTY HAS BEEN ADVISED OF THE POSSIBILITY OF SUCH DAMAGES. TO THE FULLEST EXTENT PERMITTED BY APPLICABLE LAW, ANY OF THE LICENSORS OR ANY THIRD PARTY IS NOT RESPONSIBLE OR LIABLE WHATSOEVER IN ANY MANNER FOR ANY CONTENT POSTED ON OR AVAILABLE THROUGH THE RELEVANT MATERIALS (INCLUDING CLAIMS OF INFRINGEMENT RELATING TO THAT CONTENT), FOR YOUR USE OF THE MATERIALS.


