FireBench
Advancing wildfire research using simulations and high performance computing
FireBench
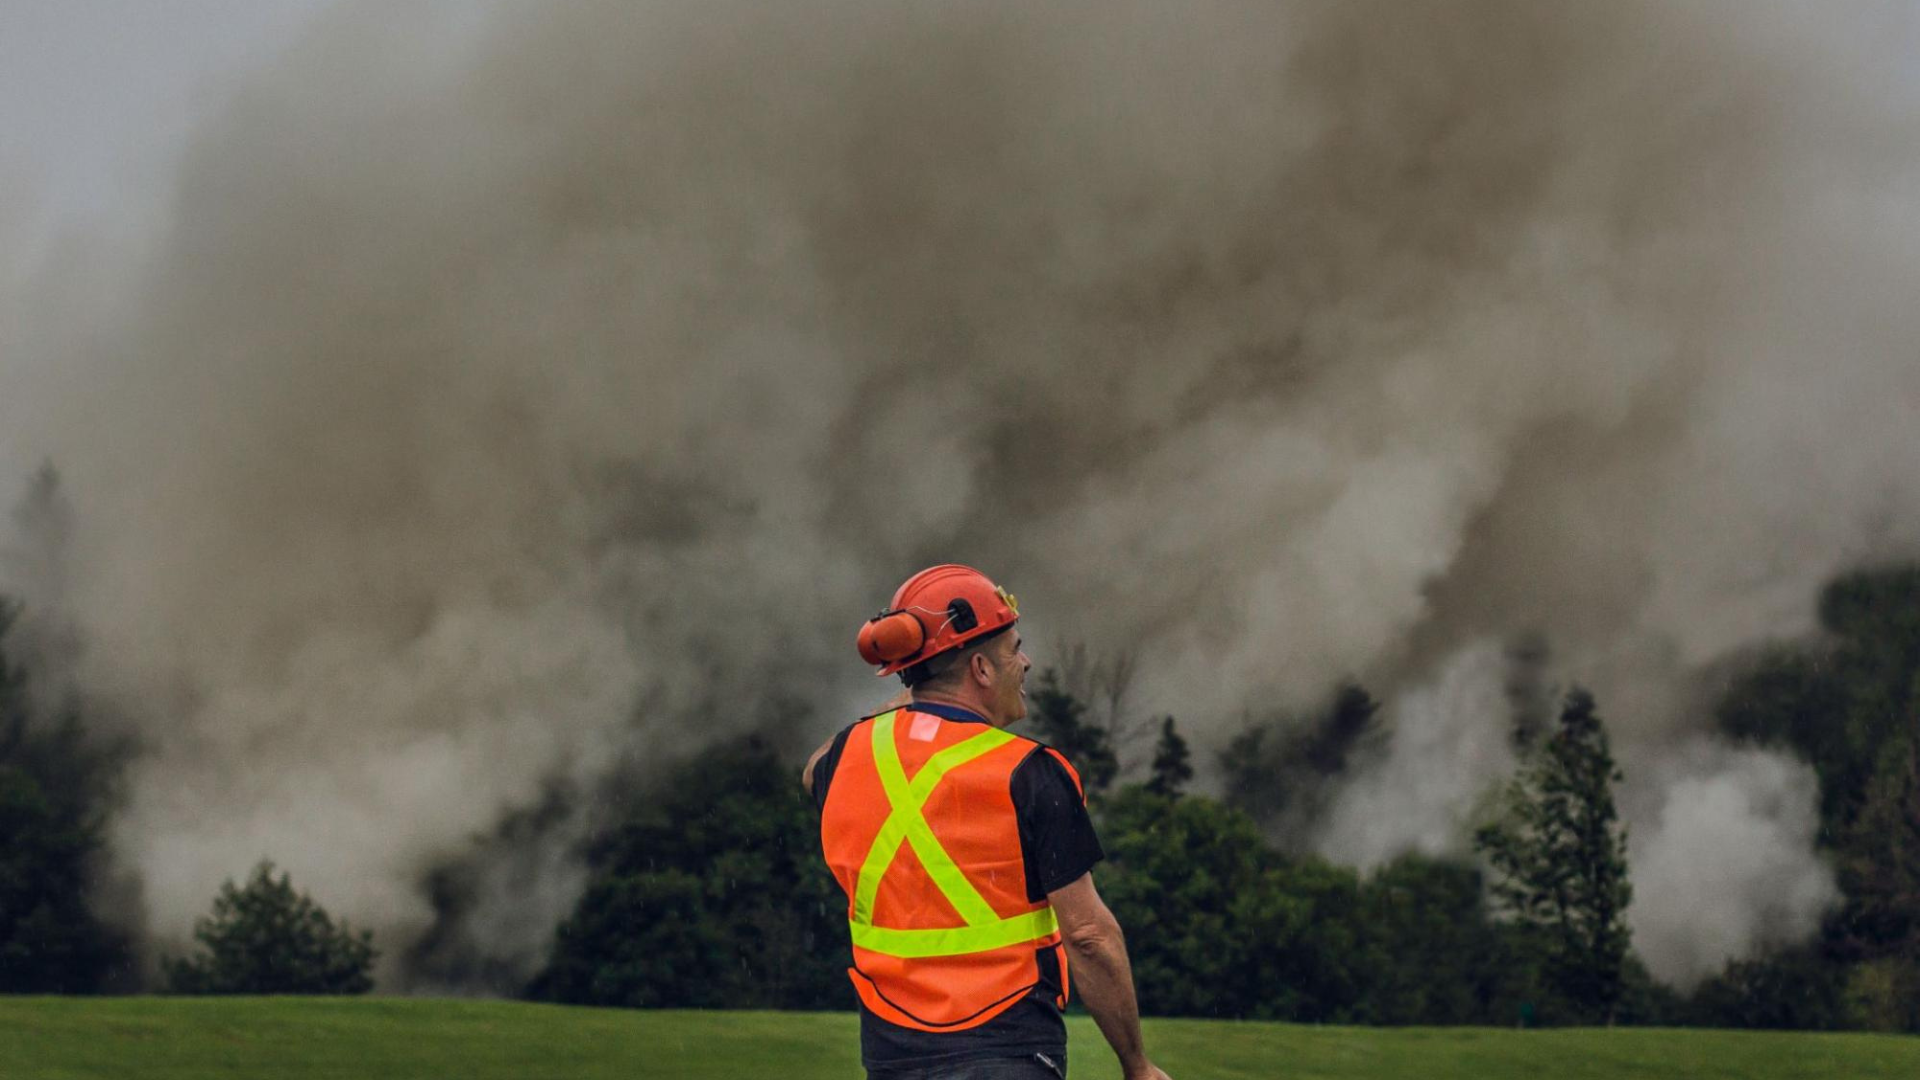
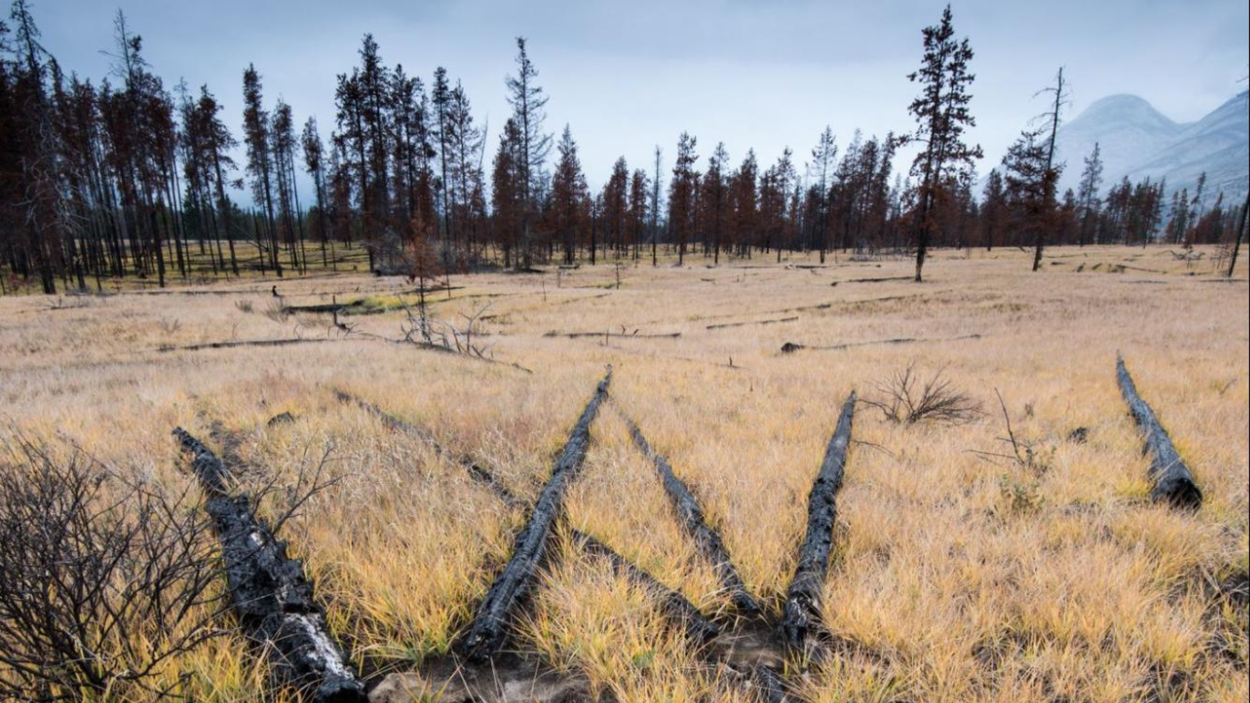
The severity and frequency of large wildfires has increased significantly over recent years, which is largely attributed to changing fire management, climate patterns, and increasing human activities in wildland-urban interfaces. While wildfires have been an important part of the forest’s natural cycle, the occurrence of the extreme fires pose serious threats to the population, environment, and ecosystem as they can disrupt, damage, and destroy infrastructure, livelihood, and properties. In particular, the recent surge in US wildfire activities has resulted in a substantial increase in size, with the annual burned-area estimated to be approaching 7M acres, annual wildfire economic burden to be between $394B and $893B, and annual wildfire CO2 emissions exceeding 50% of combustion emissions. This is expected to worsen worldwide, not only in fire-prone areas within the US, Canada, Australia, and southern Europe, but also in regions that haven’t had a history of extensive wildfires.
To that end, we introduce FireBench, a high-resolution, synthetic dataset designed to advance wildfire research. FireBench demonstrates a new way to augment observational environmental data with high-fidelity simulations to produce data that can be used for wildfire spread experiments. To provide the wildfire research community with the insights needed to develop mitigation solutions, we have released the FireBench dataset on the Google Cloud Platform. Example usage can be found in our GitHub repository.
The FireBench dataset
Facilitated by the TPU architecture, we conducted high-fidelity ensemble simulations spanning 117 different wind speeds and slopes combinations on a domain of 1500×250×1800 m3 that is discretized with 1.35 billion grid points. Each temporal snapshot of the simulations has 11 flow field variables represented in three spatial dimensions. This results in FireBench, a 1.36 PiB dataset that is efficiently stored on the Google Cloud platform.
The FireBench dataset enables investigations of fire spread behavior and the coupling between atmospheric hydrodynamics and fire physics by providing a comprehensive list of flow field variables in three dimensions beyond just fire states. It also supports the development of robust and interpretable ML models by capturing the underlying dependencies between relevant variables.
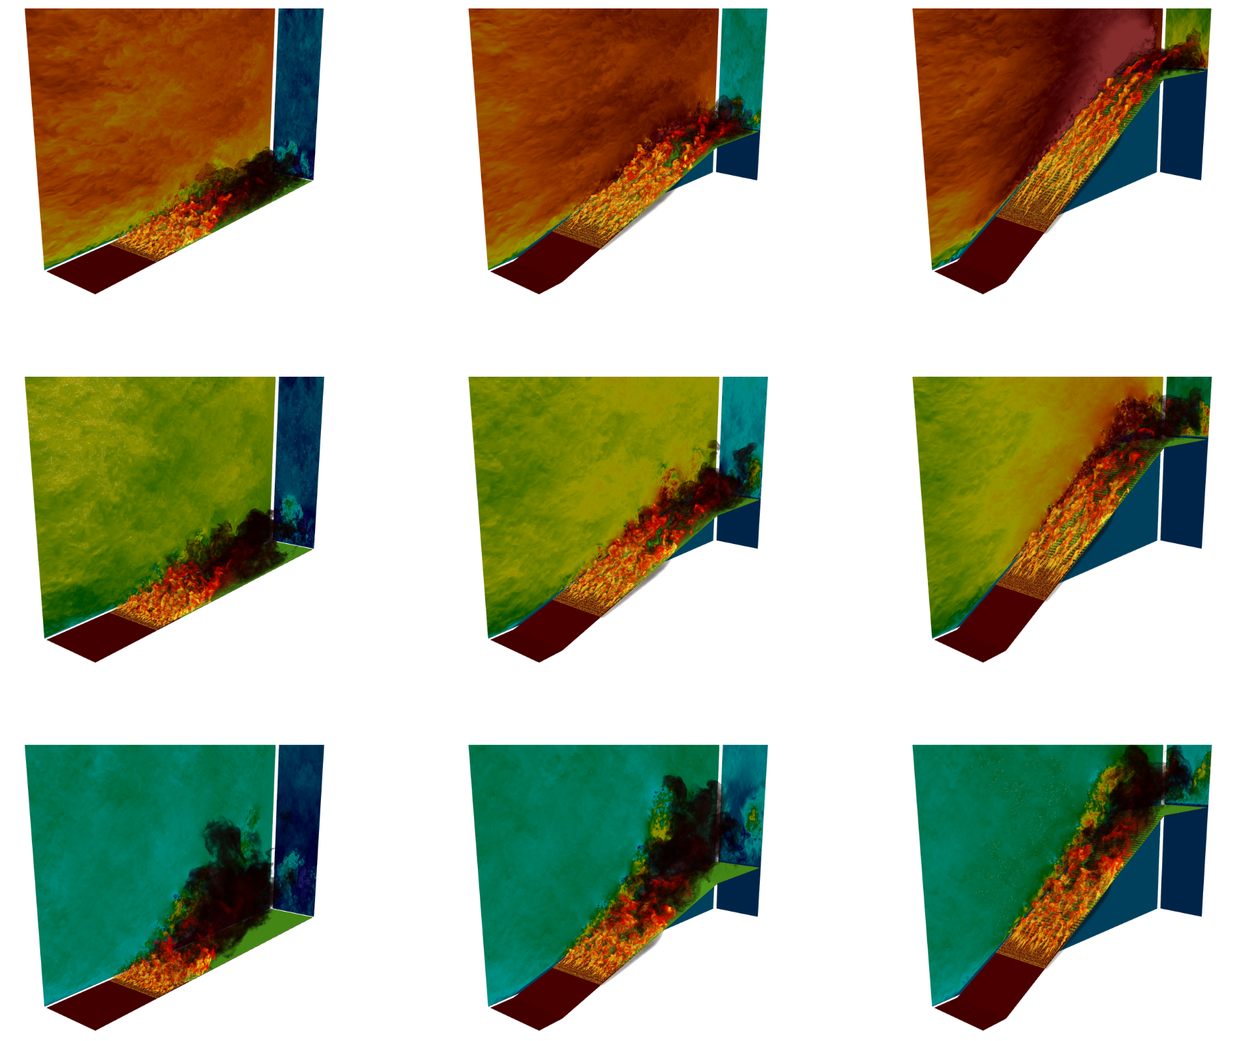
3D visualizations of fire propagation for nine ensembles when the mean location of the fire front is at 500 m. The volume renderings are of the potential temperature (indicated by the fire and smoke-like structures in the foreground of each figure) and the projections of axial (x−zplane) and vertical (y−zplane) velocity components. Each row includes simulations at a different wind speed (2, 6, 10 m/s; from the bottom) and each column represents a different slope angle (0,15, 30 degrees; from the left). The ground on the slope shows the fuel density.
These results show realistic fire behaviors with good resolution in the turbulent flow field and corrugated fires. As the fuel on the ground gets burned, fire rises to tens of meters above the ground and propagates along the direction of the wind. As the fire rises, it interacts with the local wind gusts to form chaotic finger-like structures.
Code
In our initial GitHub repo, there are two sample scripts that demonstrate how to access and process the FireBench dataset.
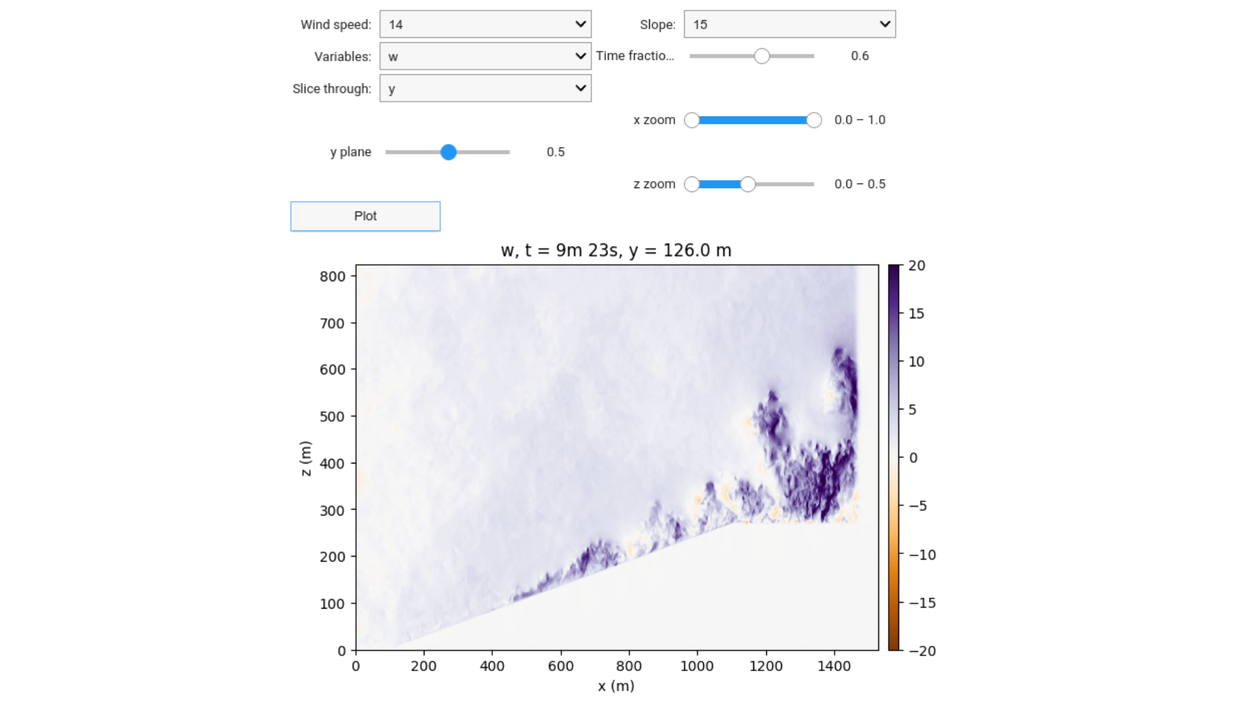
The first is a Colab notebook that presents a simple UI to browse the FireBench dataset. The script in the notebook scans the simulations in the public FireBench dataset to populate its UI dropdowns. Additionally, it can plot a simple slice of the data given the selections in the UI.
In the UI example below, the simulation with a mean wind speed of 14 m/s and a slope angle of 15° has been selected. For demonstration, we picked the vertical velocity, w, from the Variable list, and presented an instantaneous slice over the lateral direction, i.e., the y axis, at the time that is at 0.6 of the total simulation time. Note that values for the Time fraction, Slice through, x zoom, and z zoom sliders are relative to their full range, respectively. In the plot, the y slice is shown at the middle of the y axis, with a full range along the x axis and the lower half range of the z axis.
The second script is an Apache Beam pipeline that demonstrates how to postprocess the FireBench dataset. Each simulation is several TBs of data, so we use Apache Beam to run post-processing code in parallel on multiple machines. This sample script computes a time series of mean, minimum and maximum variables of all variables for a given simulation.
Use cases
FireBench is the largest wildfire simulation dataset to date, enabling the generation of ensembles of fire evolution scenarios and combining observational environmental data with high-fidelity simulations. From development of fire propagation models, to investigations of fire and atmospheric dynamics, or even construction of novel machine learning models related to turbulent multiphase fluid flows, the applications of FireBench are promising.


