Decisions are made based on a combination of values, examples, and explanations, the importance of which can vary greatly across readers. Provide readers with a guided demonstration or exploration of your dataset that reaffirms your Data Card.
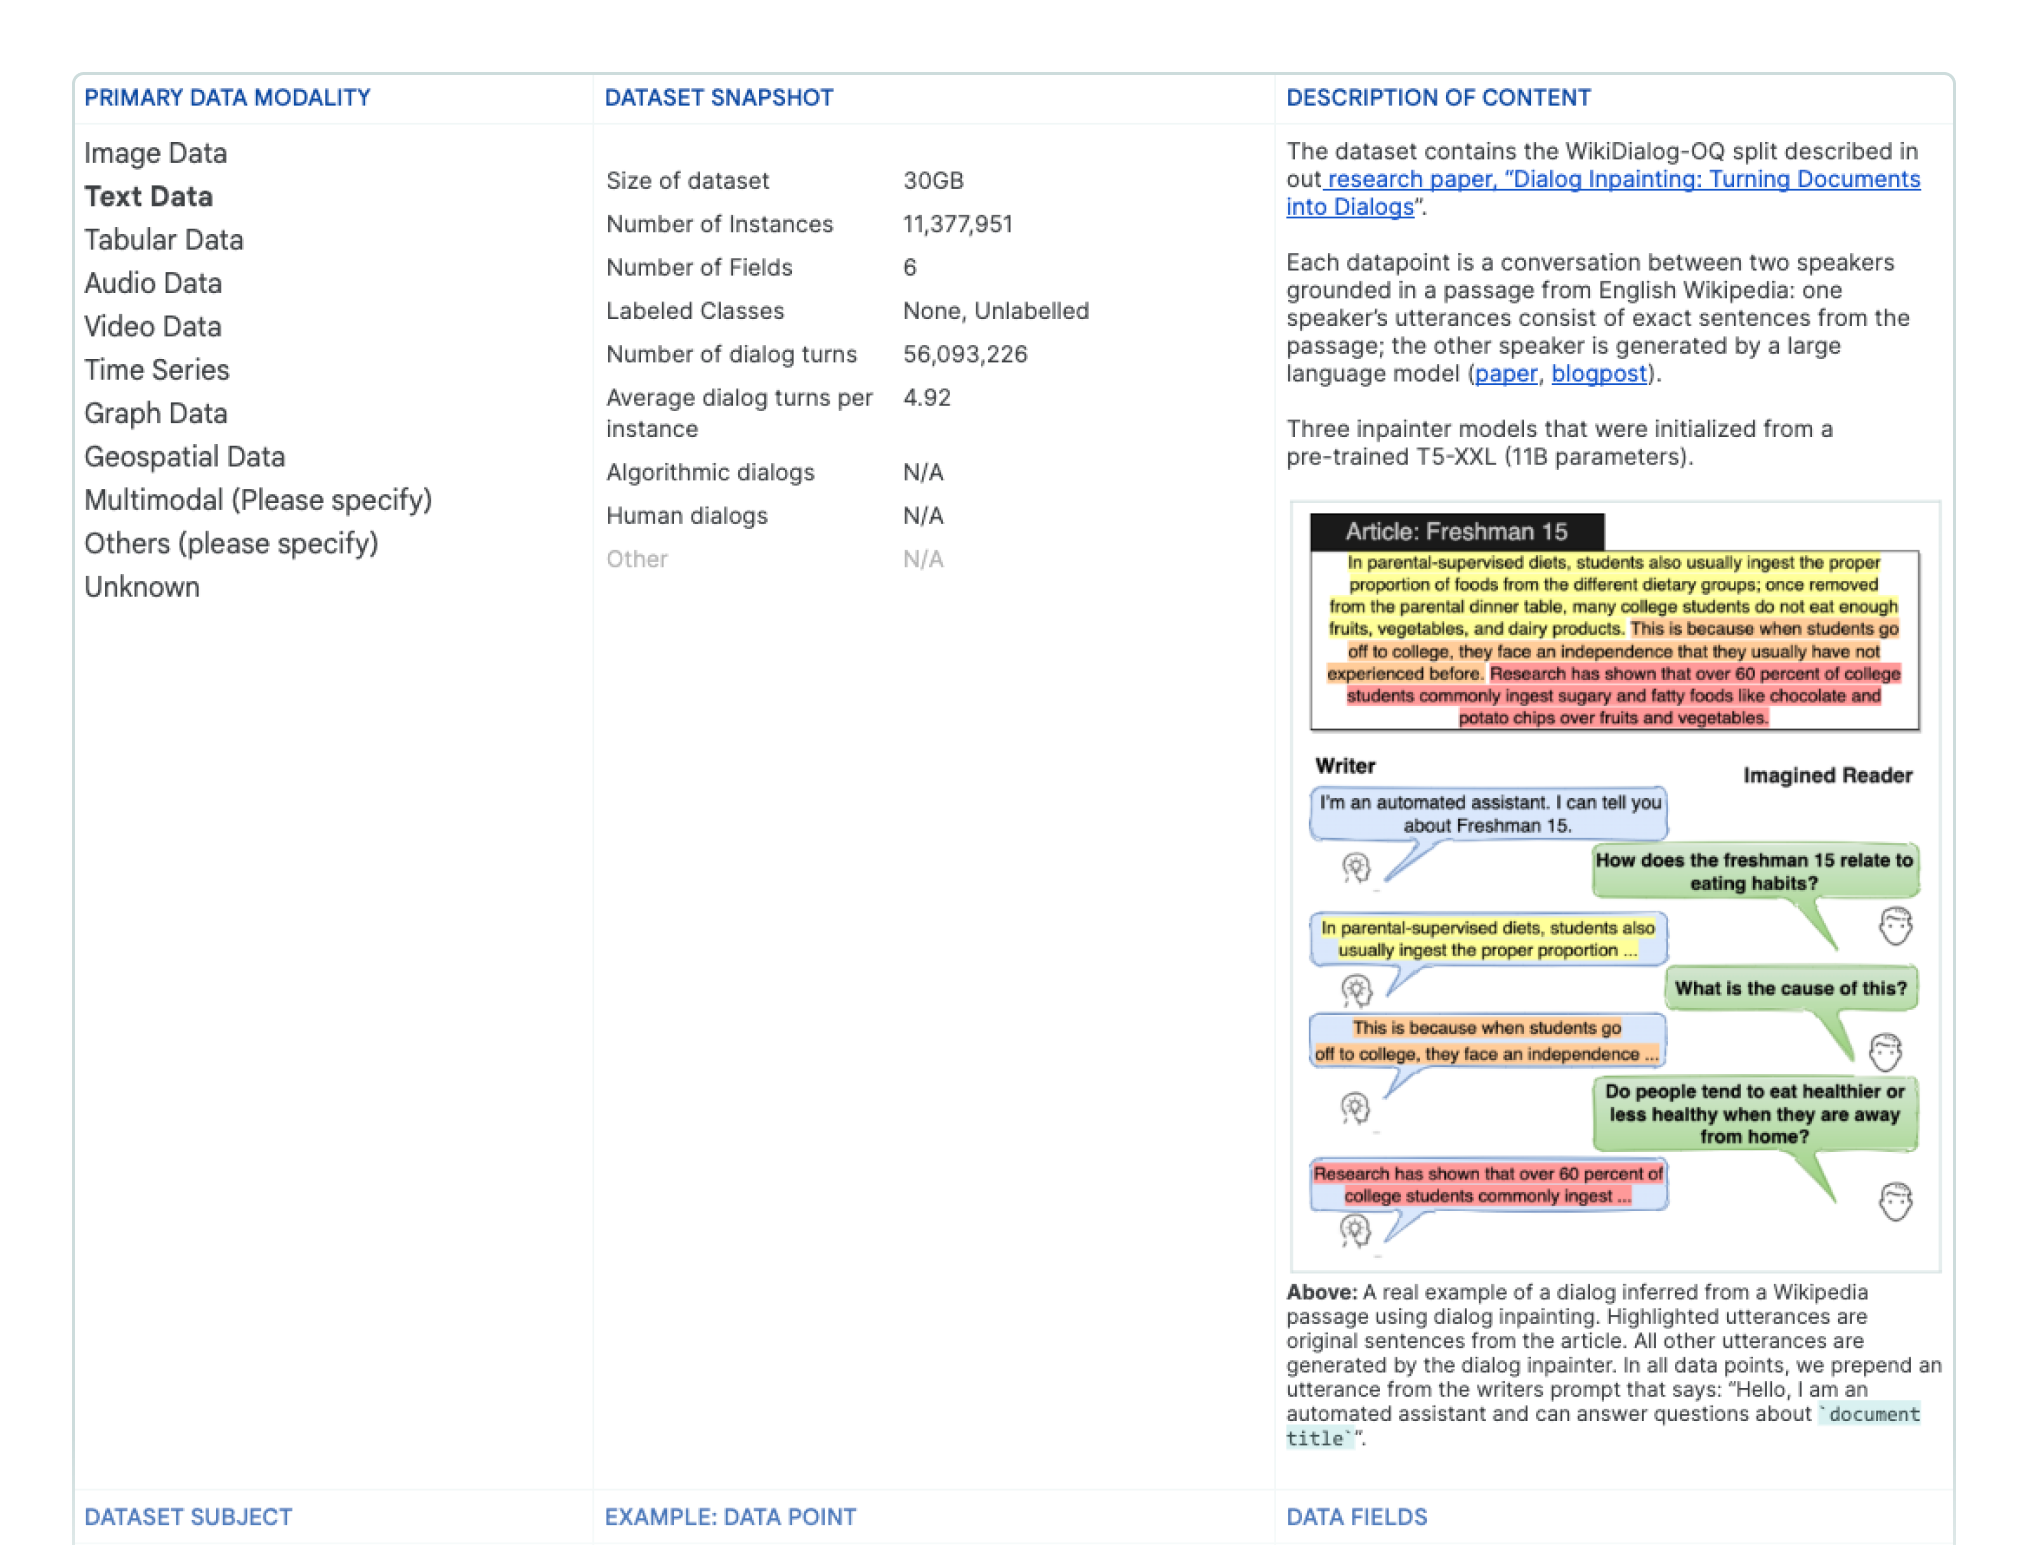
Data Cards and dataset demonstrations work in tandem as a feedback loop, enabling readers to explore individual observations while being able to zoom out and see the bigger picture or learn about factors beyond the dataset. Data Cards build an intuition before readers explore your datasets in an interactive environment so they don’t misinterpret your dataset – and inversely, experiencing your dataset first hand can prompt questions, for which your Data Card should provide proactive answers.
Show, don't tell.
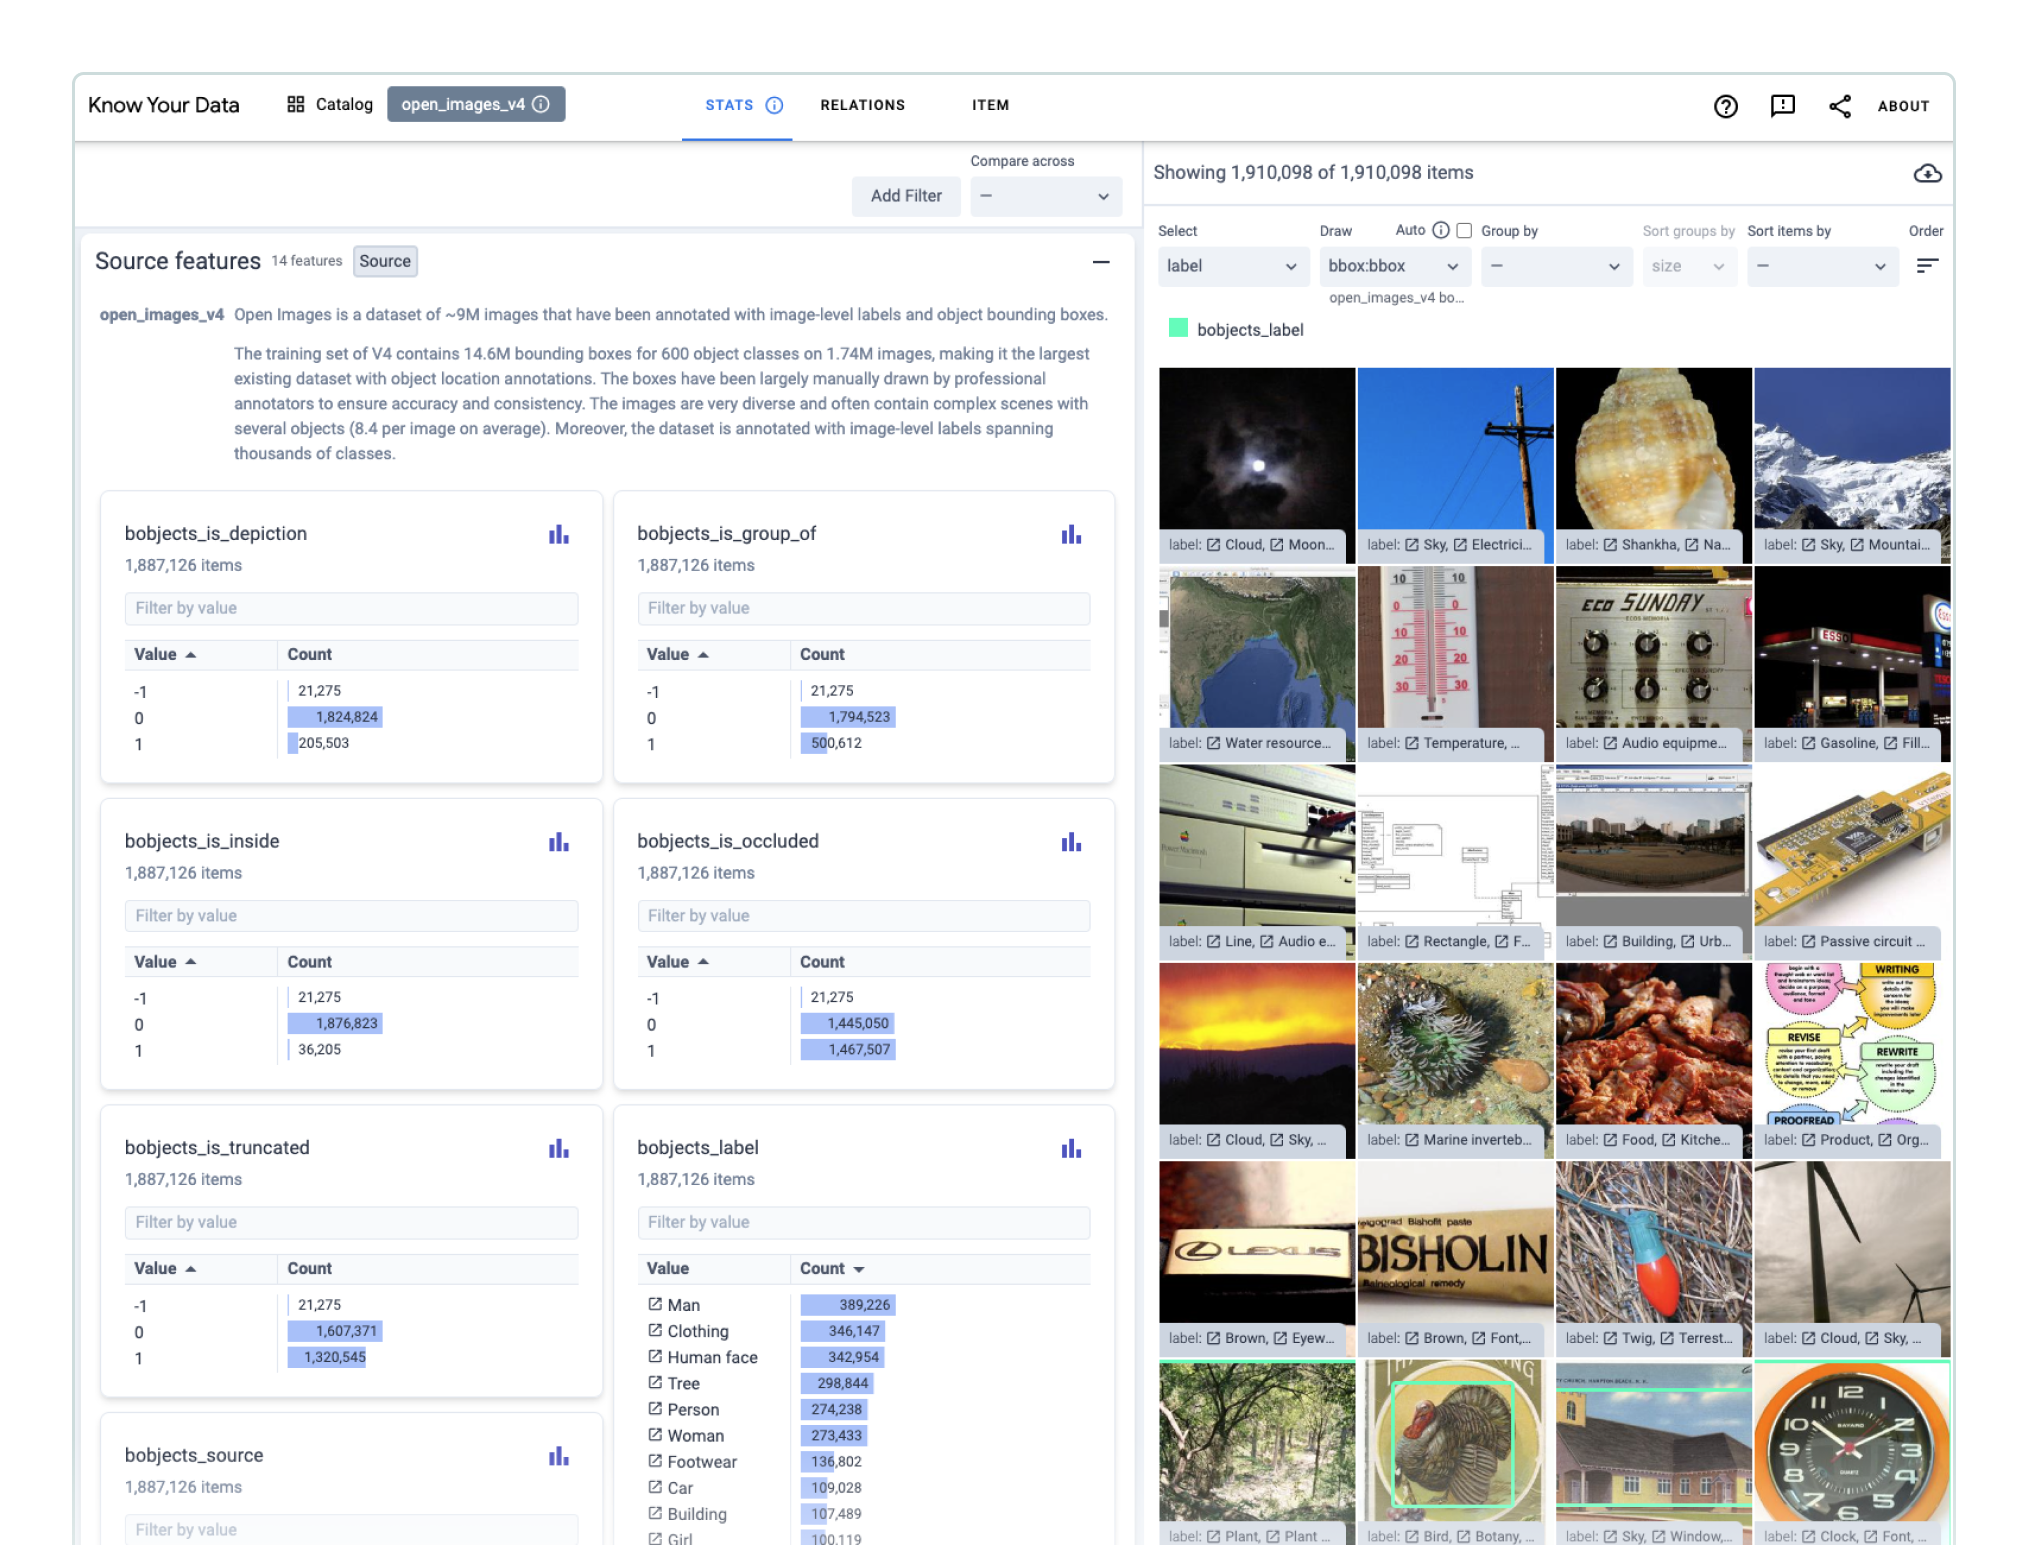
A demo, either in its entirety or a subset, is a great way to give readers a hands-on experience of your dataset.
Augment free-form explorations by recommending concrete questions that readers can investigate as soon as they start interacting with your dataset demo. Ideally, questions should help readers predict when their models which are trained or tested on your dataset might fail.
Tables and dense visualizations can sometimes be too much information.
Even if your Data Card is designed for agents with a range of proficiencies, providing a table of comprehensive performance metrics and analysis results, or a dense static visualization can be overwhelming and cognitively exhausting to a reader.
Instead, consider creating an interface that advanced readers can use to sub-select metrics and visually explore the boundaries of the performance metrics, labels, and other attributes of your dataset – in their contexts. For even more advanced readers, consider interactive experiences that allow users to manipulate thresholds, or apply filters.