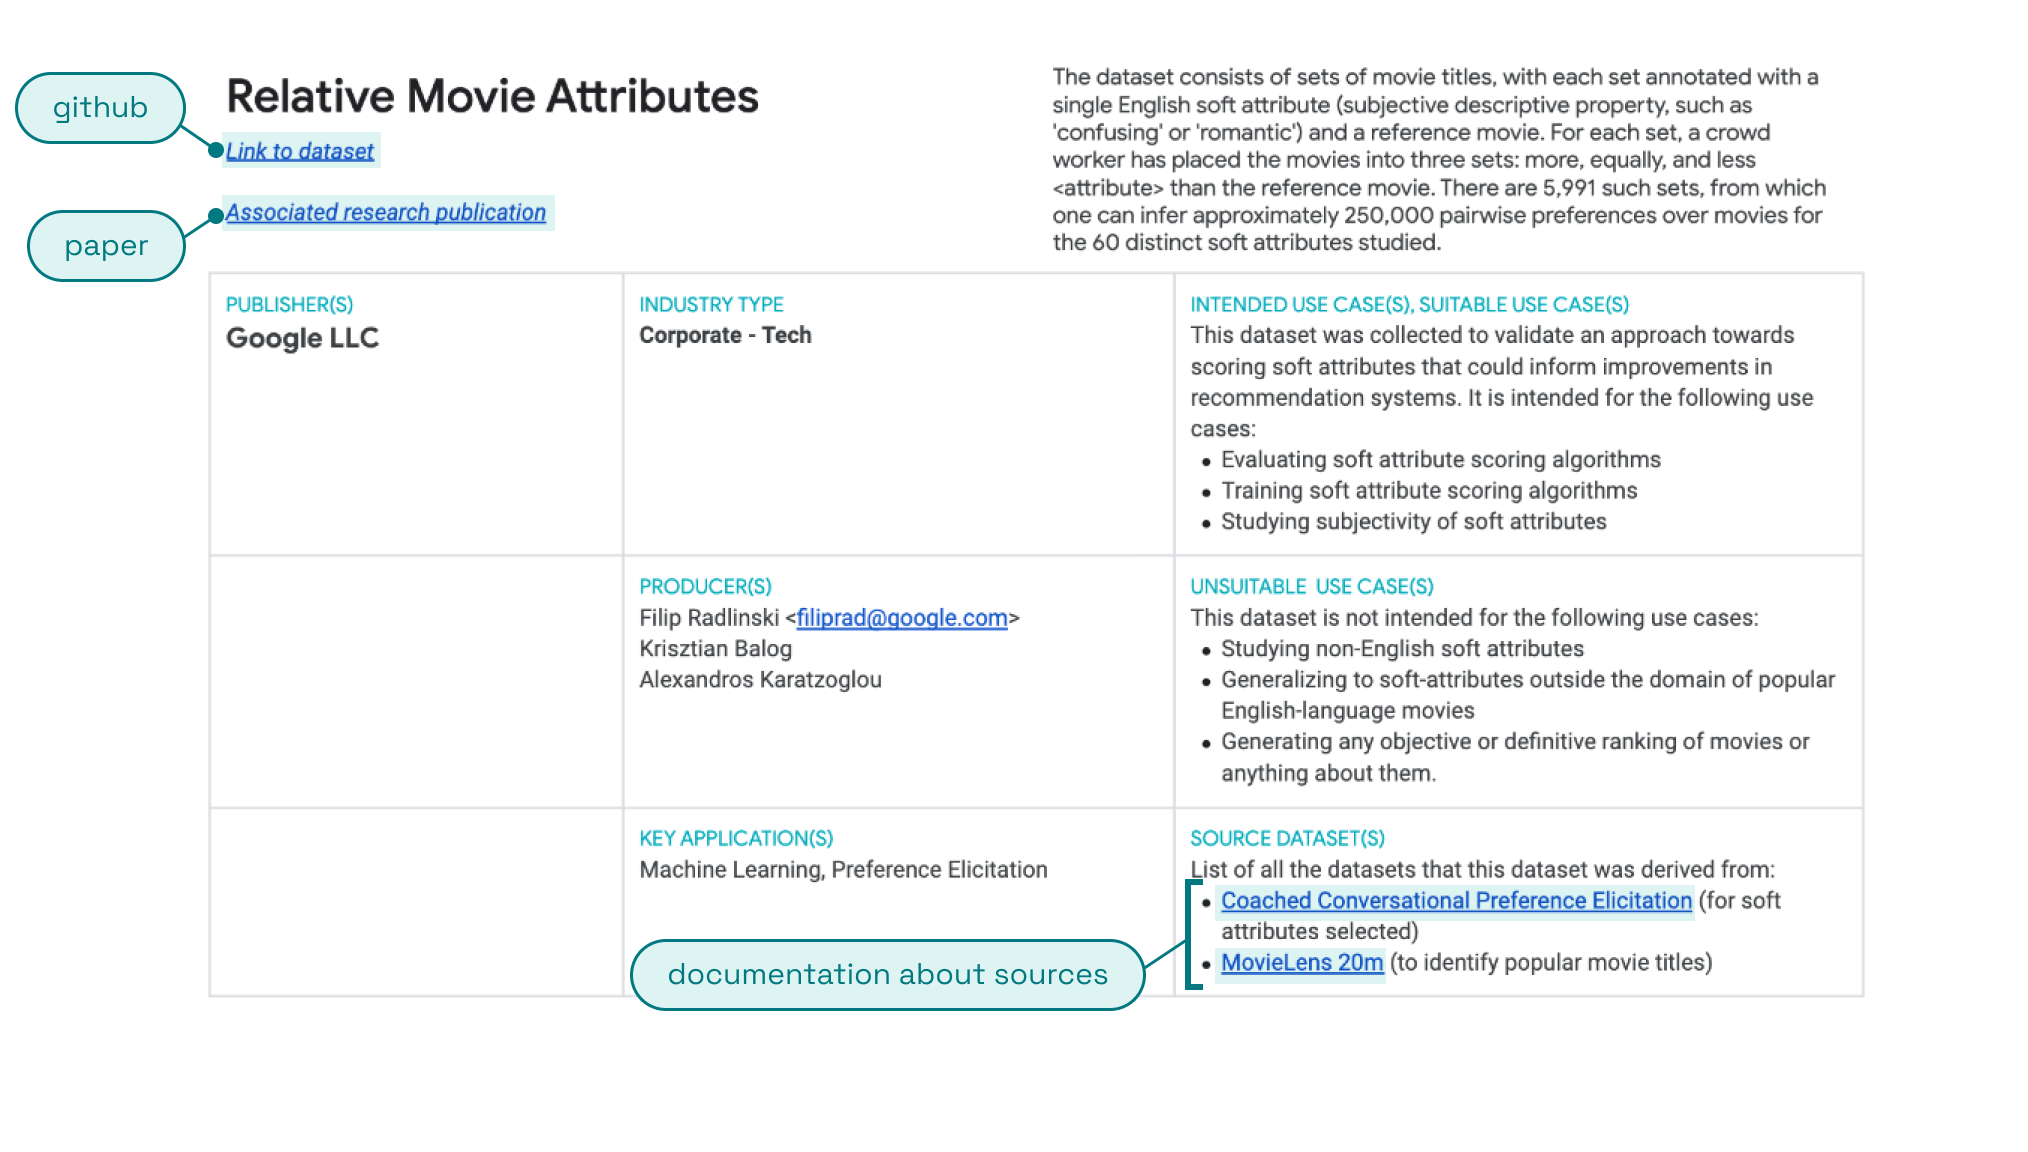
The best Data Cards are created over iterations, and with the input of diverse voices. It helps to engage subject matter experts, specialized job roles, and plan at least two rounds of review or feedback to get your Data Card right.
Data Cards are transparency artifacts that emphasize information and context that shape the data, but cannot be inferred from the dataset directly. Framing explanations and rationales about essential transparency topics (such as provenance, representation, usage and fairness) are harder to answer than technical documentation because they can be interpretive and have specific socio-cultural contexts.
Ask for documents.
For historical datasets or large projects which involve multiple stakeholders, answers may be distributed across documents and in the working memory of collaborators – much of which would never have made it to documentation.
Ask your collaborators for answers, and rely on multiple sources of information for the truth.

Don't underestimate the time needed to fill out a Data Card.
Filling out technical fields and summarizing disparate documents into the Data Card can take a few hours. The work of framing, validating, and conducting additional analyses can take much longer.
Identify and involve experts and stakeholders early, and account for a few rounds of feedback.
